Ever since the original Raspberry Pi was released in 2012, I was very fond of the concept and always had it on top of my wish list. I had a bunch of Arduino Uno’s and sensors like the DHT11 to measure temperature and humidity, but the Arduino lacks the versatility of the Pi.
I wanted to take my project to the next level and (finally) bought myself a Pi at kiwi-electronics.co.uk. I started off with a starter kit including the Pi 4 B with 4 Gb RAM. Soon a couple of Pi Zero W followed to measure individual rooms. I upgraded my sensors and wrote some software in Java and Python to monitor them and created a dashboard using Grafana to visualize and analyze the data. In this article, I will explain why I’ve started this project and what I’ve learned from it.
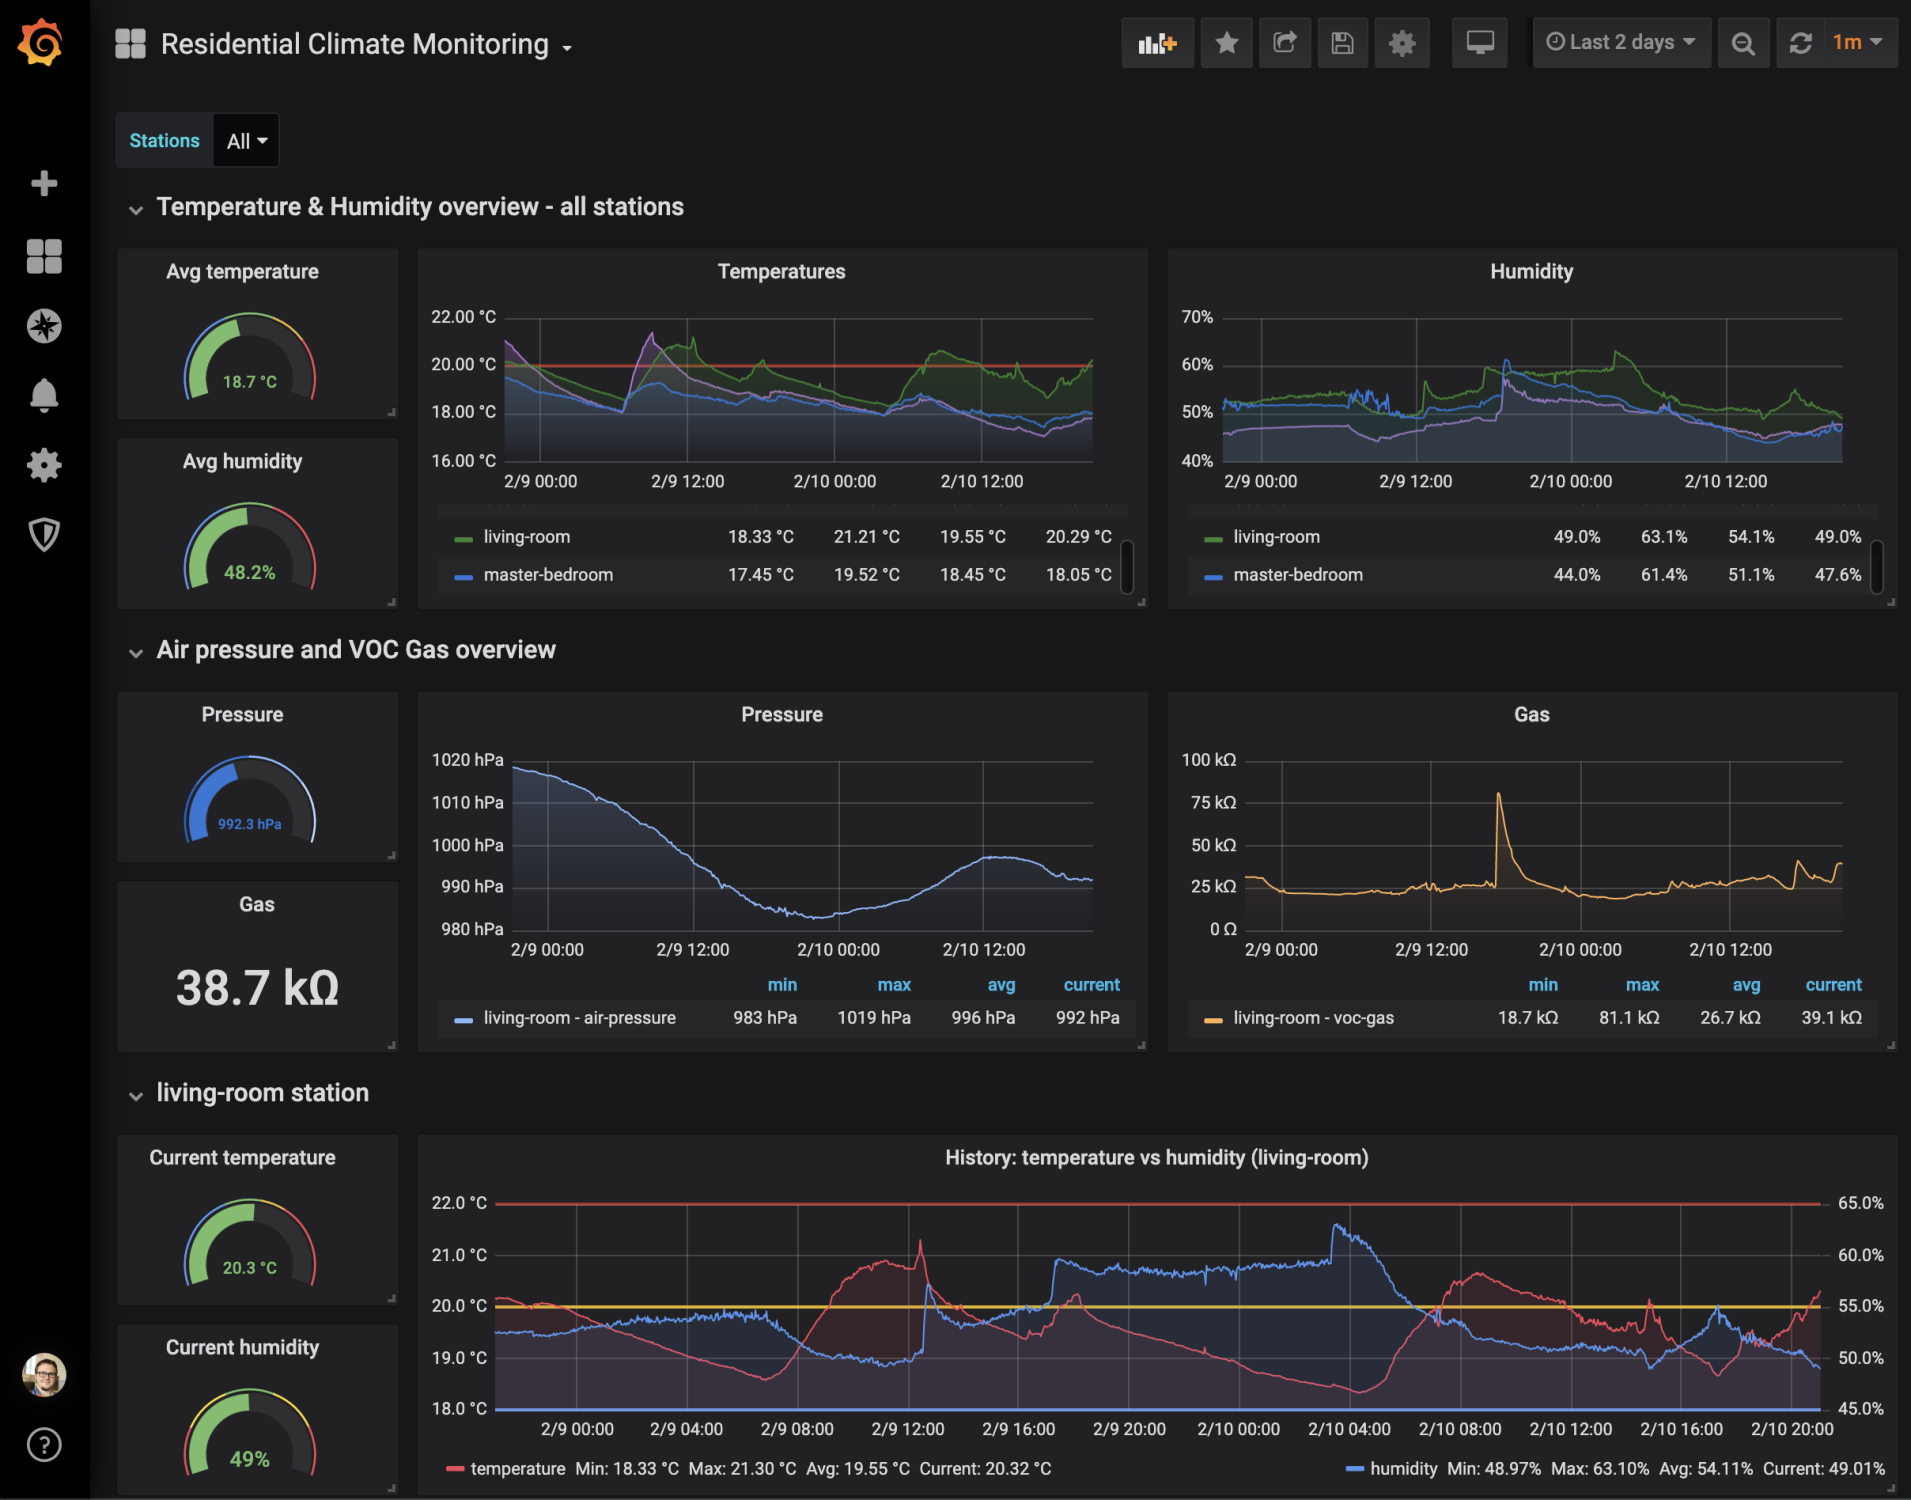
I bet you can’t wait to see the dashboard so here you go, a sneak peek to ease the mind:

USE CASE
Besides just doing this project for fun I actually have a good use case to monitor the temperature in my home. The ground floor is heated using floor heating, while the second floor is heated with traditional radiators. It’s somewhat outdated (from the ’60s) and I have no idea how well it is insulated. I often noticed that upstairs it’s rather warm while downstairs it’s still chilly. I wanted to measure how effective my heating system was per room. With this data, I could verify if I balanced the heating system properly and adjust it where necessary.
THE HARDWARE
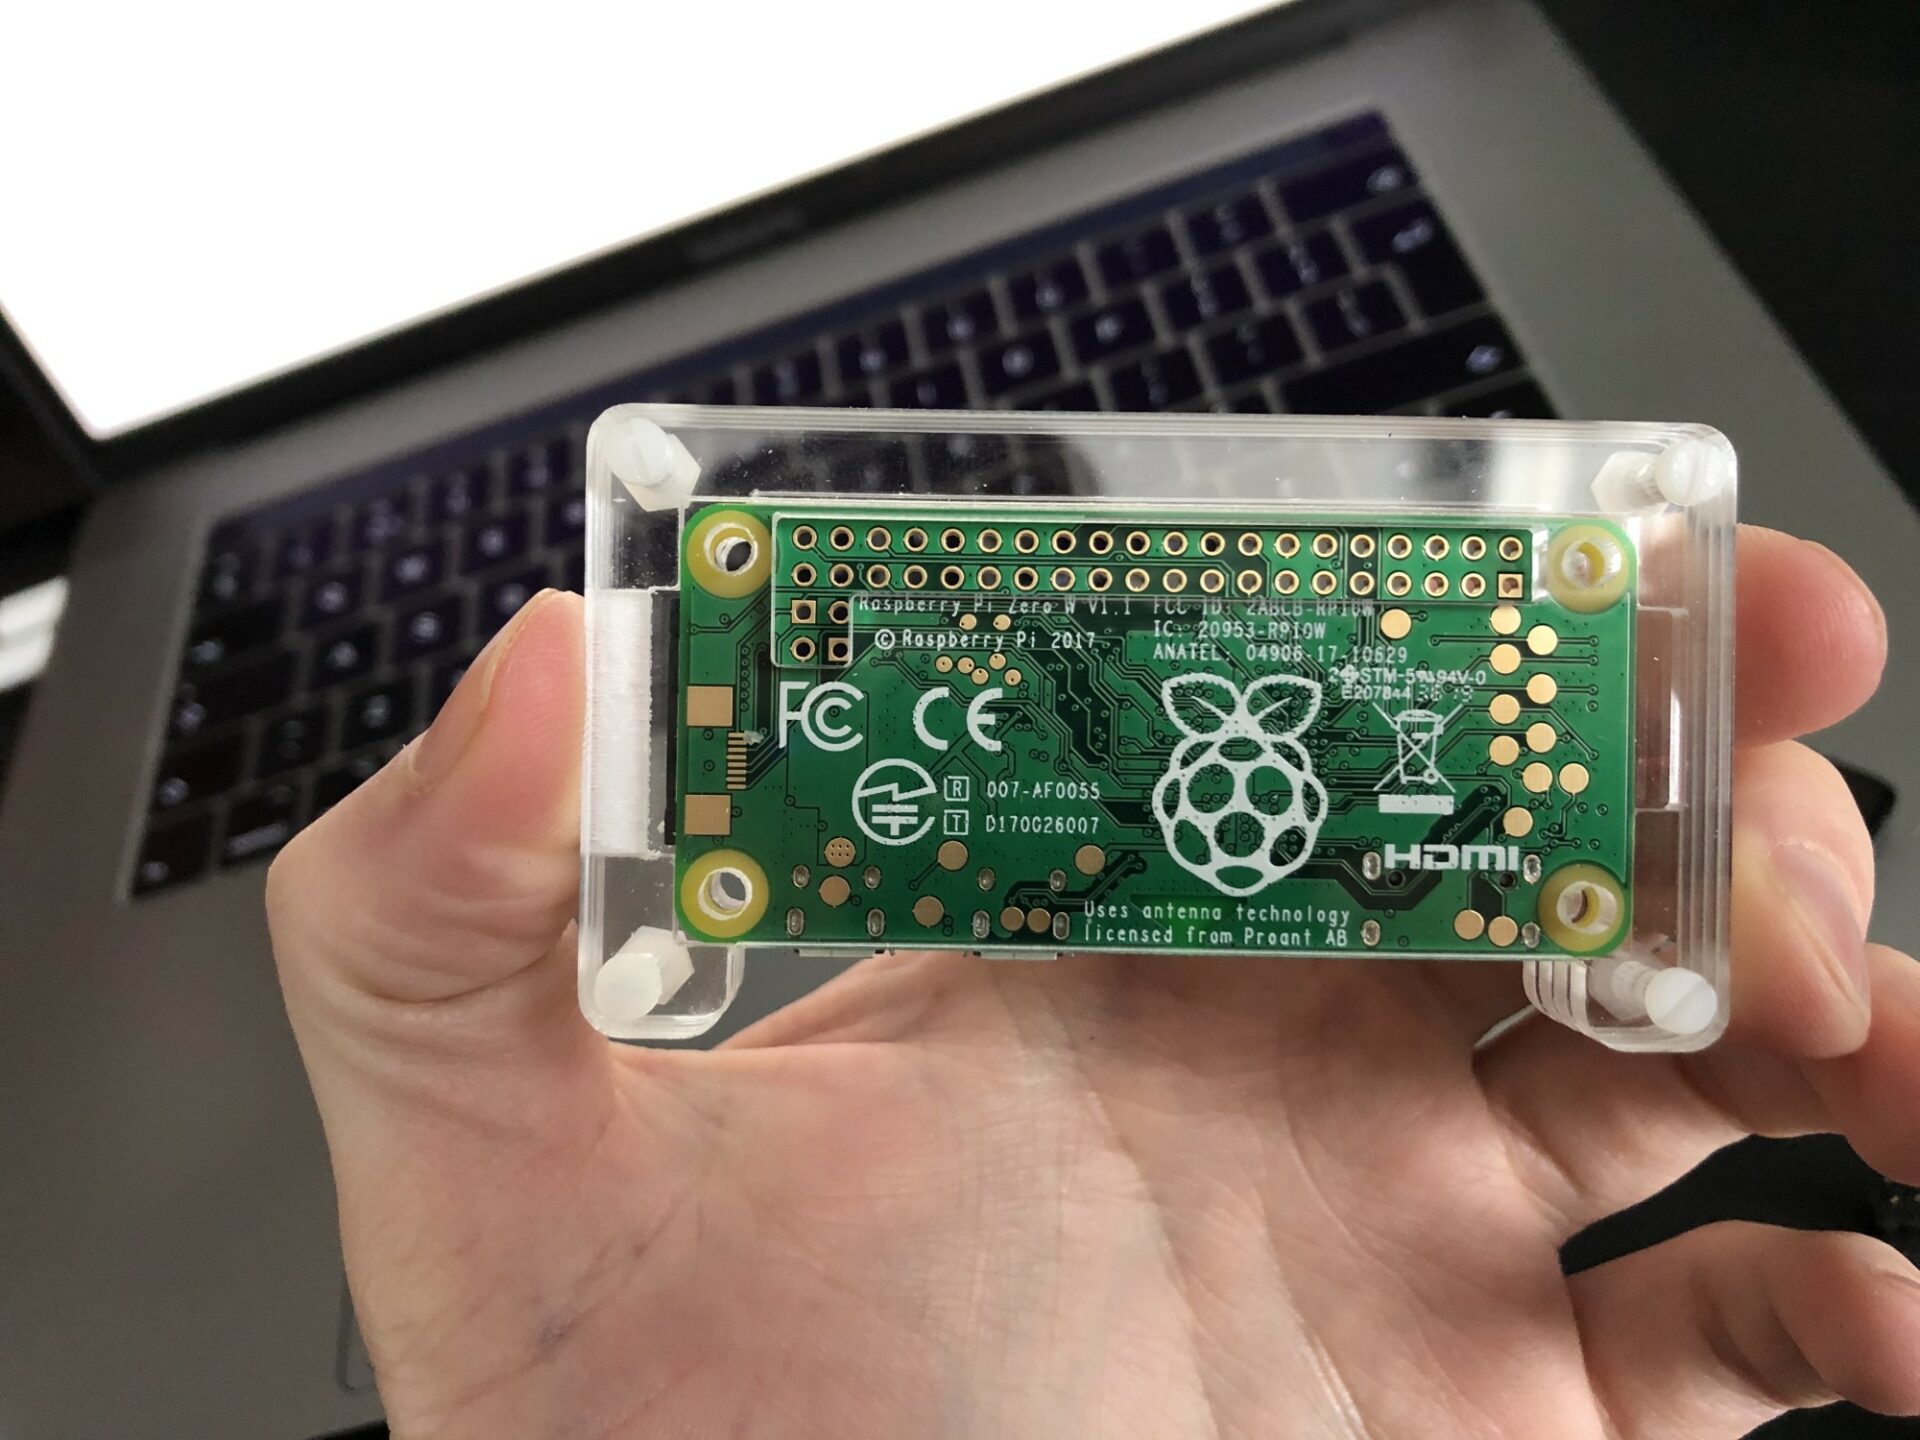
My requirement is to measure at least the temperature per room without having a lot of cables all over the place. So it’s going to be a wireless set up mostly. I don’t want to rely on any cloud service and I want to have an independent system. I have a Synology NAS but I did not want to run anything on it for this project. So I needed a central place to gather the data and run my software and Grafana. The powerful Pi 4 B is an ideal candidate to do this. Thanks to its 1.5 GHz quad-core ARM processor and 4 Gb of RAM it will have no issues running some docker containers with Grafana and my Java app. For the individual rooms, I was looking for a more lightweight/wireless solution. In 2017, Raspberry released a wireless edition of their Pi Zero. It has the same CPU as the original Pi but clocked at 1 GHz (single-core) with 512 Mb of RAM. This is perfect for running a lightweight Python script to read the sensor, connect to the WiFi and send the readings to the main Pi. I know there are cheaper and even simpler solutions possible to suit this scenario, but I want to keep my options open for the future.

SENSORS AND ACCURACY
What I liked about the DHT11 is that it also measures humidity. Humidity is also an important aspect of in-house climate quality. Good indoor humidity lies between 40 and 60%. While looking for an alternative sensor to upgrade the DHT11 with, I stumbled upon the Adafruit BME680. The BME680 has an accuracy of ± 3% humidity, ± 1.0 degrees Celcius. Compared to the DHT11, which has an accuracy of 5% humidity and 2.0 degrees Celcius, it’s a nice improvement.
In addition to temperature and humidity, the BME680 also measures air pressure. With an accuracy of ± 1 hPa air pressure, it is also possible to measure altitude with an accuracy of ± 1 meter, since air pressure changes with height. To calibrate the sensor, the current sea level pressure for the location must be set. E.g. from https://knmi.nl/nederland-nu/weer/waarnemingen.
Last but not least, the BME680 also measures volatile organic compound (VOC) gas. This is a group of hydrocarbon gases including SMOG, butane (used for cooking) carbon monoxide (very toxic to humans) etc. The sensor can’t tell which gases it measures but it can be used to detect trends and for comparison. This also requires calibration against known sources. I haven’t looked into the detail but I’ve already detected some interesting trends with it. More about that later.
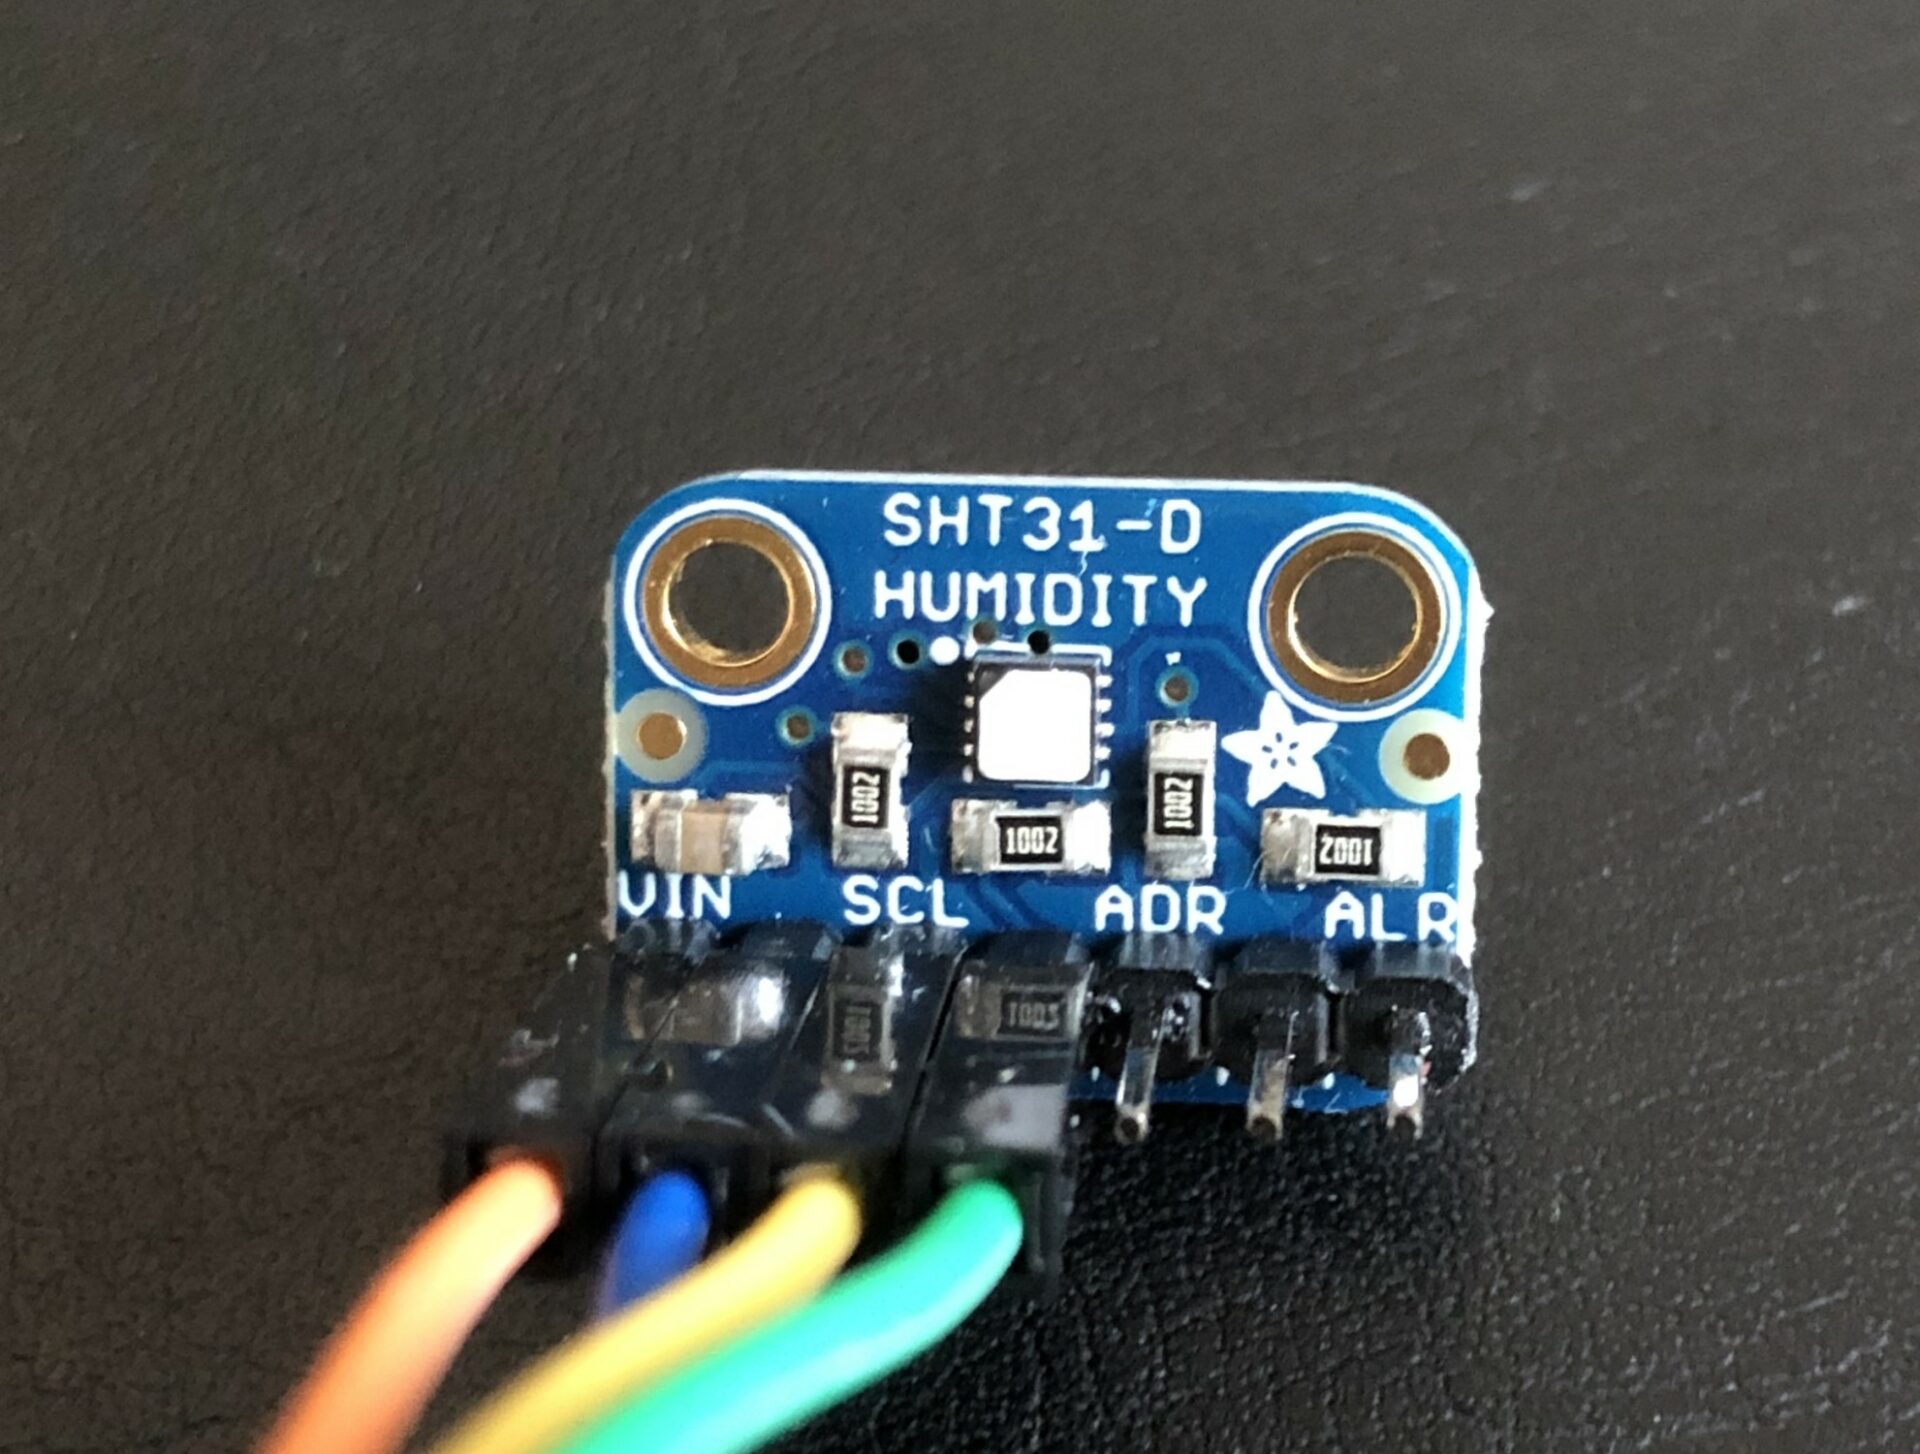
For the Pi Zero W in the rooms, I was looking for a cheaper sensor to keep the project within a reasonable budget but without compromising the accuracy. The Adafruit SHT31-D is a good candidate that suits my requirements quite nicely. It is even more accurate than the BME680, but only measures the temperature and humidity. It has an accuracy of ± 2% humidity and ± 0.3 degrees Celcius. The little white chip in the center is the actual sensor.

ACCURACY VERSUS RESOLUTION
Accuracy tells us something about how far off the value can be from the actual value. Resolution is the level of detail, think of it as pixels, except in this case less is more. The “higher” the resolution (the lower the value) the smaller the difference it can measure. The BME680 has a resolution of 0.01 degrees Celcius and 0.008% humidity. Whereas the SHT31-D has a resolution of 0.015 degrees Celcius and 0.01% humidity. So the SHT31-D is more accurate but comes with a slightly less detailed resolution. Compared to the DHT11, which has a resolution of 1 degree Celcius and 1% humidity, this is a huge improvement.
COMMUNICATION BETWEEN THE PI AND ITS SENSORS
The sensors can be read using I2C (Inter-Integrated Circuit) and SPI (Serial Peripheral Interface). These are very common communication protocols for hardware and are both supported by the Pi. I never used I2C or SPI before, so which one to pick? I2C requires only 4 wires, it’s less susceptible to noise compared to SPI and I2C ensures that data sent is actually received. On the other hand, SPI is faster. Speed is no issue for me and I like the simpler wiring so I2C it is.
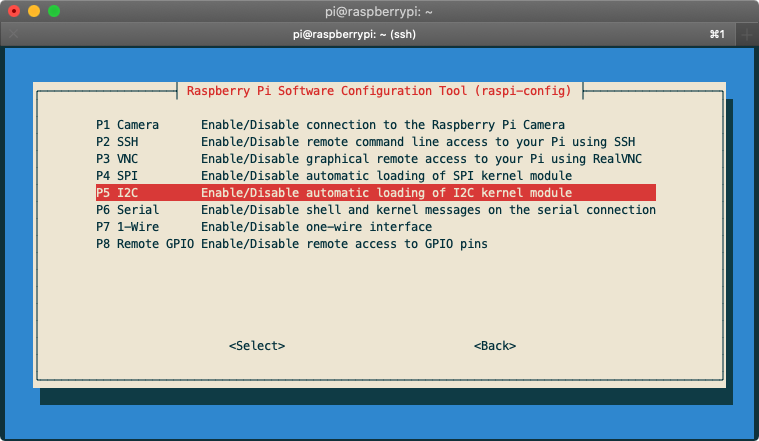
Note that I2C and SPI are disabled by default on the Pi. It should be enabled before it can be used. To enable I2C SSH into the Pi, run `sudoraspi-config` and select Interfacing Options -> I2C -> Yes -> Finish.
I2C is now enabled and ready to be used straight away, no reboot required. SPI can be enabled in the same way if you chose to use SPI instead of I2C.

THE SOFTWARE
The software of this project can be divided into two groups:
- Station monitoring service
- Measuring stations
The station monitoring service is a Spring Boot application written in Java 13. Its purpose is to manage the measuring stations and to accept measurement reports from the measuring stations for monitoring. The measuring stations are basic scripts written in Python to read the sensors and report them to the service. Currently, I have two types of measuring stations, one for the BME680 and another for the SHT31-D because they each use a dedicated library developed by Adafruit that is specific to the type of sensor. Let’s look into the details of each component individually:
STATION MONITORING SERVICE
The station monitoring service is where it all happens. It exposes an API (defined in the OpenAPI specification) that allows me to manage the stations that will be monitored. What metrics will be monitored depends on the sensors that are configured for each station. The sensors are also managed in this service so it knows which sensors can measure which metrics. I will only have to make adjustments to the code when I add a new type of metric.
Besides managing the stations, it also exposes an endpoint for the stations to submit their measurement reports to. Each time a report is received it will be validated against the configuration in the service and processed for monitoring. A station can submit a report for each sensor individually or for multiple sensors combined, but only with one value per metric at a time. The service uses the vendor-neutral monitoring facade from micrometer.io which is the default monitoring tool in Spring Boot. Think of it like Slf4j for logging, but then for monitoring. It dictates certain naming conventions that should be followed for optimal compatibility. When applied correctly, it allows you to switch from monitoring platform vendor without any changes to your code!
Micrometer provides an interface called a Meter Registry which acts like a phone book for all the meters that are being monitored. It requires a vendor-specific implementation. Luckily it supports many vendors out of the box, so which one should I choose? Friends of mine are very enthusiastic about Prometheus and recommended it to me. Besides, Grafana has first-class citizen support built-in for Prometheus and they are both open-source. An excellent candidate for my project!
There are multiple types of meters that can be used for monitoring. I’m using a ‘gauge’ meter for monitoring since the metrics that are being measured by the stations all have natural bounds. Frequently updating a gauge is pointless because a gauge meter only changes when observed (by the monitoring tool, not my sensor). So how are these meters observed? The Prometheus Micrometer library for Spring Boot publishes the data of the meters that are monitored under the `/actuator/prometheus` endpoint. This is how it looks like:
Prometheus periodically scrapes this data from the station monitoring service and stores it in a time-series database. Each meter has a unique combination of the name and tags. ‘sensor_readings’ is the name and ‘metric’ and ‘station’ are the tags. I’m still experimenting with what combination of name and tags works best. The data in the time-series database can be queried by tools like Grafana to visualize and analyze it, but more about that later.
MEASURING STATIONS
The measuring stations take care of reading one or multiple metrics from one or more sensors. Each sensor can be read using a dedicated library written in Circuit Python. This is a flavor of Python suitable for microcontrollers like the Raspberry Pi. To show how incredibly easy it is to use it, here is a code example for the BME680:
That’s it!
Ok, almost :-). I added some extra code to communicate with the station monitoring service and added logging for troubleshooting with log rotation to avoid the Pi running out of disk space. To read the sensor periodically I have chosen to use Crontab to configure the Pi to execute the script every minute. The benefit of crontab over a timer or loop in the code is that it automatically runs the script even if the Pi reboots and keeps the code cleaner. The crontab configuration looks like this:
The “*” are wildcards for minute, hour, day of month, month, and day of week. This will execute my script every minute. The script will read the sensor, similar to the example above, and then post the measurements to the station monitoring service on the `${station-api}/measurement-reports` endpoint. The name of the station is also put in the payload so the service knows which meter to update. The ${station-api} variable points to the (static) IP address of the Raspberry Pi running the station monitoring service. This allows me to easily move the service to the cloud.
VISUALIZING THE DATA
Grafana is very good at visualizing the data stored in Prometheus. I was really pleasantly surprised how easy it was to set up the connection to Prometheus and create my first dashboard. Without further ado, here is the full-blown thing:

The top row shows the average temperature and humidity to see the overall quality of the climate. It also shows two graphs with the history of the temperature and humidity combined. The second row is dedicated to air pressure and VOC gas since I have only one sensor measuring this. The next rows are identical and show the details of a single station. This shows the temperature and humidity in one graph in more detail. That huge spike in VOC gas was at the same time I was cooking dinner, guess I’d better start cooking with induction!
CONCLUSION
WHAT’S NEXT?
The weather has a considerable impact on the effectiveness of the heating system. I am planning to either add an outside sensor or fetch local weather data from an online source and add it to my dashboard so I can correlate it with the in-house temperature changes.
I’m also planning to hook up with my Nest Thermostat and/or smart meter to monitor what my heater is doing. It supports OpenTherm so my Nest can modulate it, that will be interesting.
I’ve made all my software available as open-source (under the MIT License) and can be found here: https://gitlab.com/residential-climate-monitoring. You should be able to replicate this project with similar hardware by following the instructions in the readmes/wiki using the 1.0.0 release :-).
I hope you’ve enjoyed my very first article so please let me know what you think. If you have a similar project I’d love to hear your story!


